Best Data Visualization Projects of 2016.
- by R27
- in Blog Data Visualisation
- posted January 2, 2017
Visualization continues its merging into the everyday — less standalone and more of a medium that blends with words. I think this is partially because of a concentration on mobile. There’s simply less visual space on a phone than there is a giant computer screen, so the visualization is stripped or split up into smaller pieces that are more easily digested while scrolling.
Whereas last year seemed exploratory and long explainer-ish, this year was nimble and quickfire. Or maybe this year’s election season is still fresh in my mind. I can’t be sure.
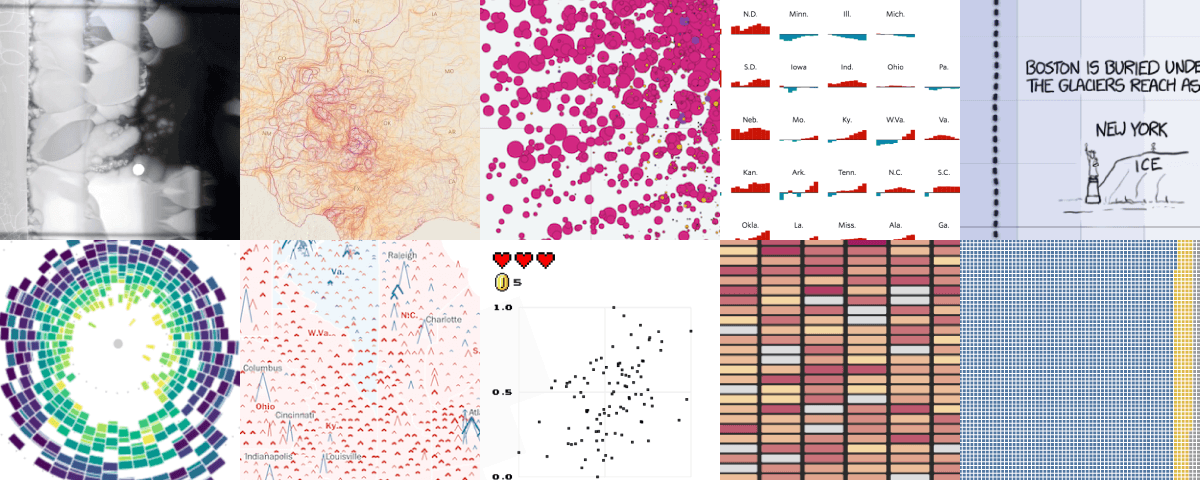
I am sure though that there were a lot of good projects this year. Below are my favorites in no particular order.
Read and see the full array of visualizations here flowingdata.com